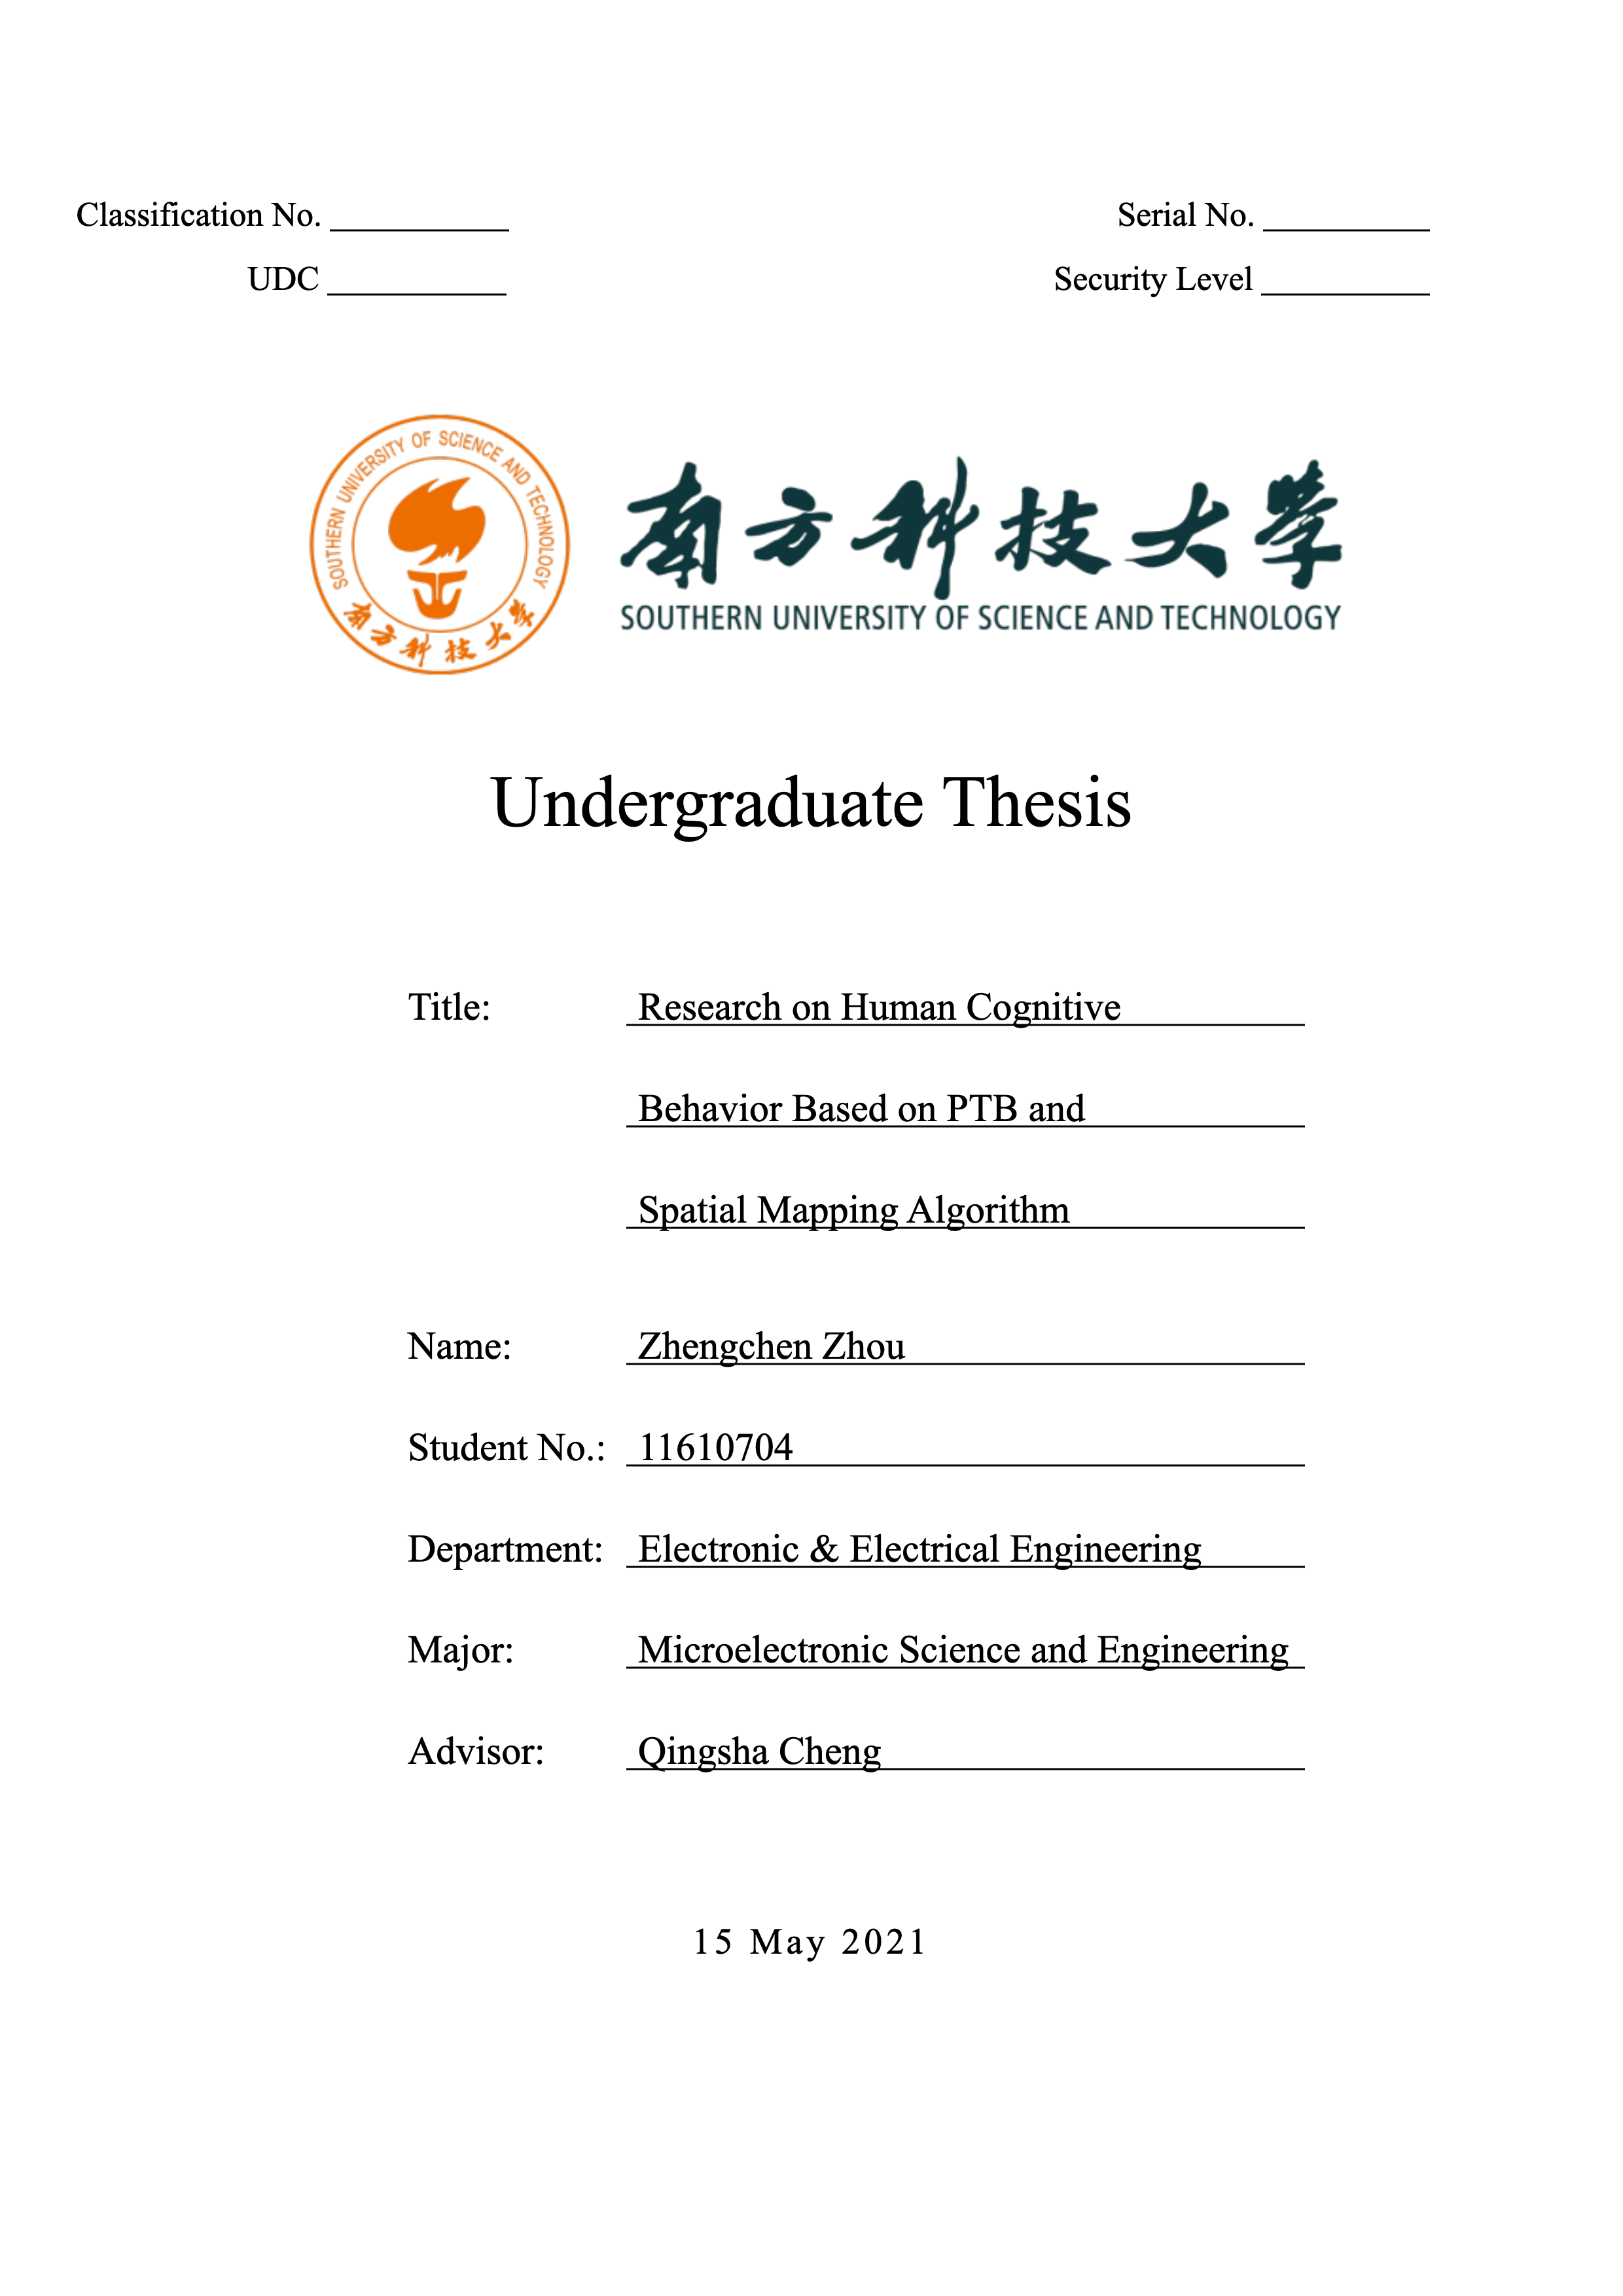
 SUSTech: A MATLAB experiment that measured how people learn an input mapping nobody explained.
Undergraduate capstone in Qingsha Cheng's lab, Department of Electronic & Electrical Engineering, the final requirement of a B.Eng in Microelectronic Science and Engineering.
For my 2021 microelectronics capstone at SUSTech, I built a MATLAB PsychToolbox experiment in which a mouse click landed somewhere the participant did not expect. I recorded how thirteen people adjusted their aim, then fitted each person's corrections with a regression estimate borrowed from Space Mapping, an electronic-design optimisation method. My advisor set the topic.
Overview
Undergraduate capstone in Qingsha Cheng's lab, Department of Electronic & Electrical Engineering, the final requirement of a B.Eng in Microelectronic Science and Engineering.
An engineering capstone that turned a question about people into something MATLAB could measure.
For my microelectronics capstone at the Southern University of Science and Technology, I built a MATLAB experiment in which a mouse click landed somewhere the participant did not expect. I recorded how they adjusted their aim and fitted a model to the resulting data. My advisor, Qingsha Cheng, supplied the research topic; I built the instrument and carried out the analysis.
The question was how quickly people work out a rule nobody tells them, using only the gap between where they aimed and where the shot landed, and whether their corrections could be described as an estimated model. Answering it meant building the task, the timing, the logging and the fitting procedure, and deciding which data counted.
The Experiment
A target, a mouse click, and a hidden transform between where you aim and where the arrow lands.
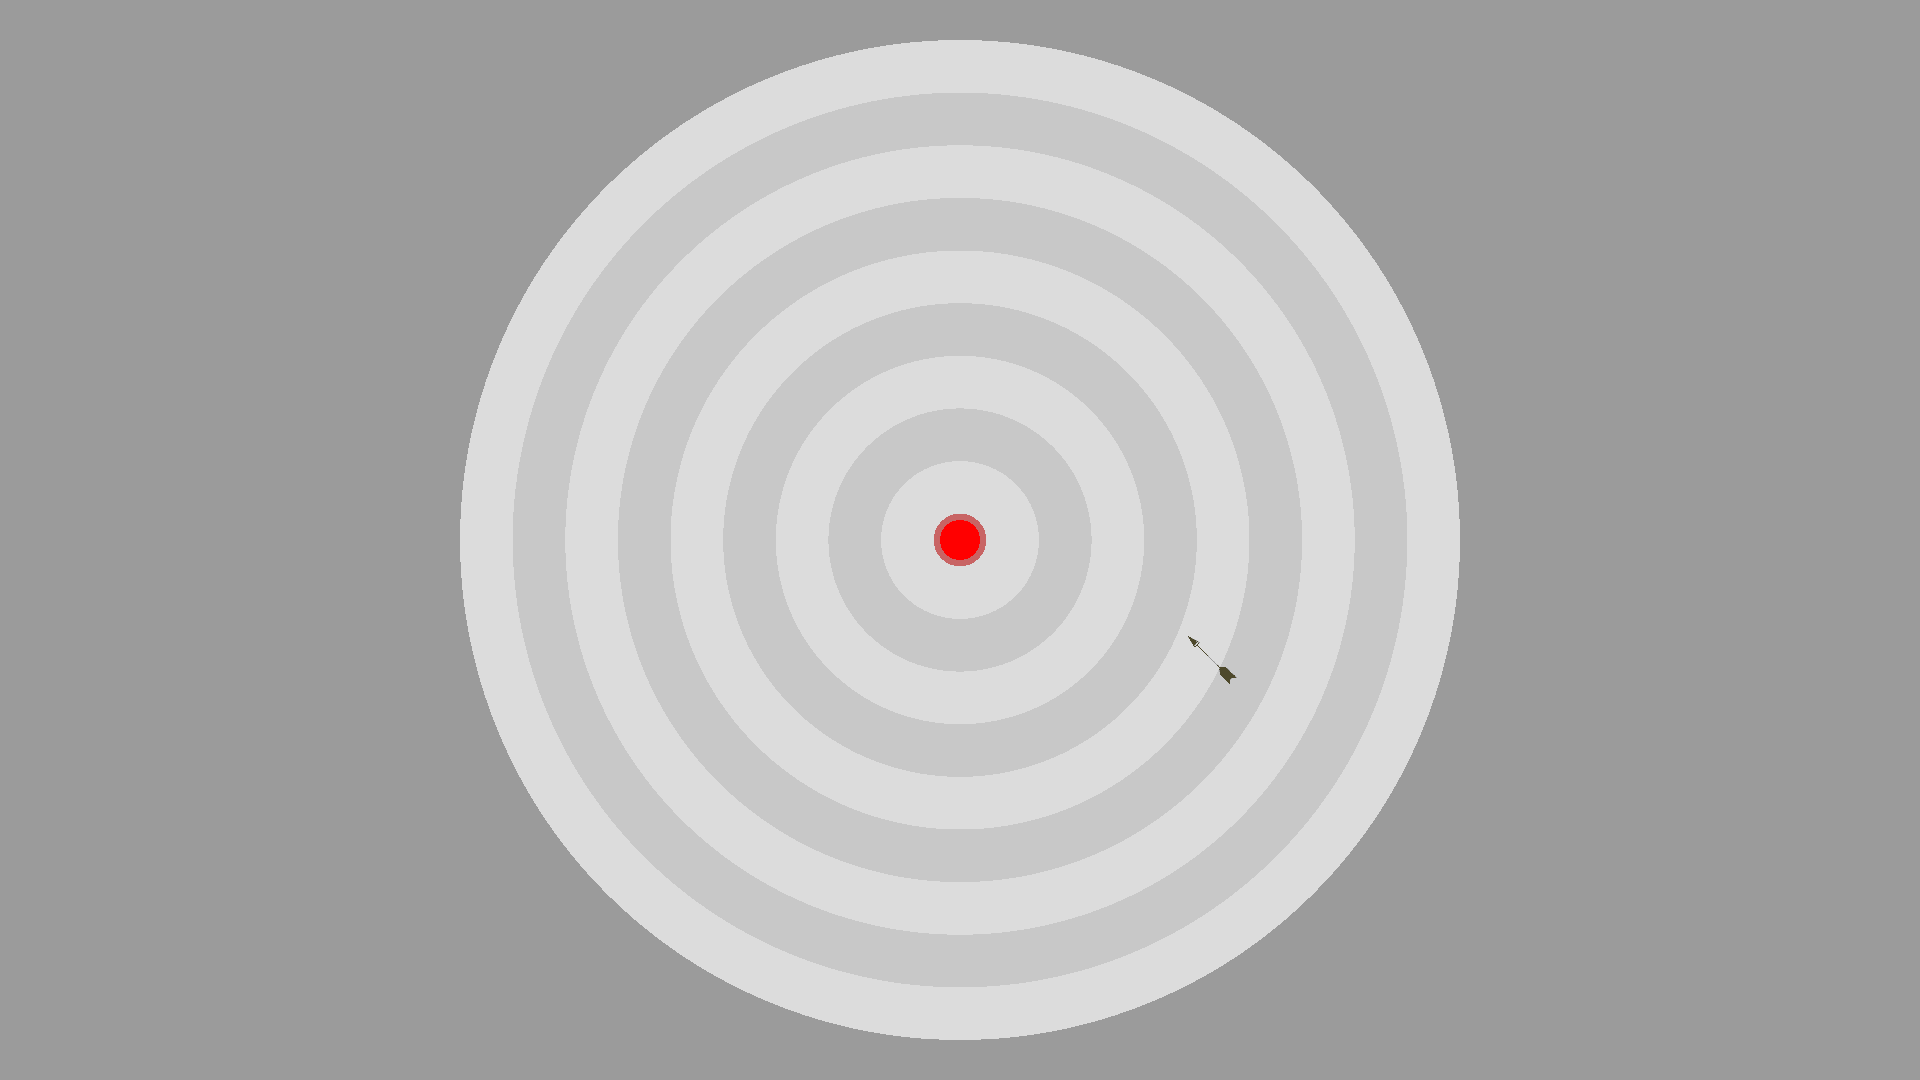
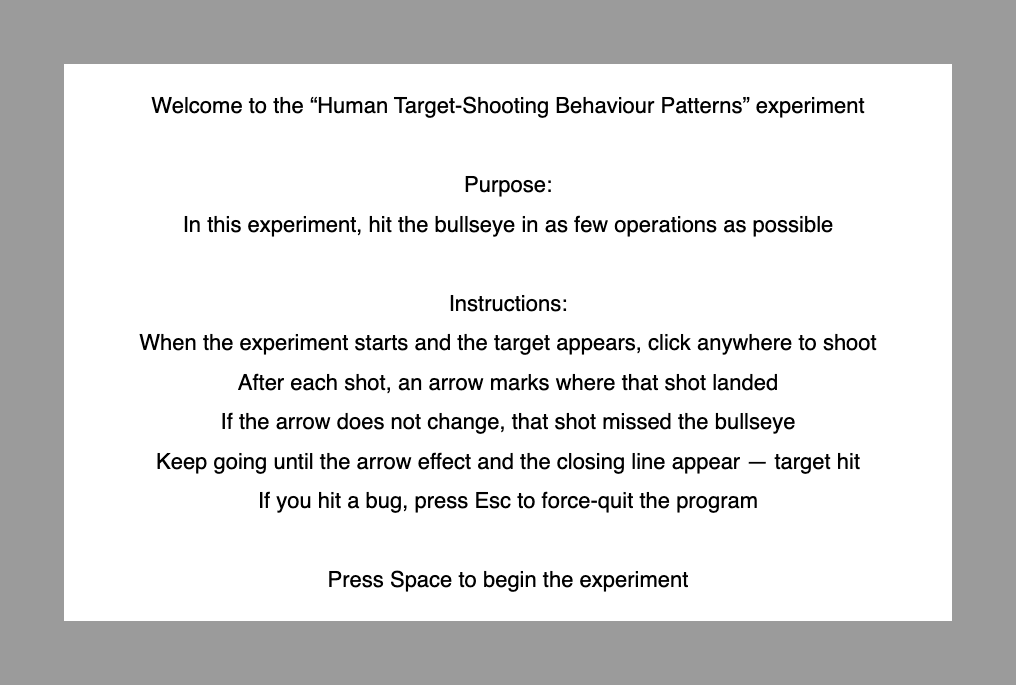
A participant sees a bullseye and is told one thing: hit the red centre in as few shots as you can. Clicking anywhere fires, and an arrow appears where the shot landed.
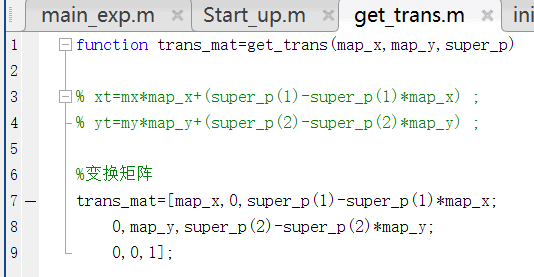
It does not land where you clicked. Between the mouse position and the arrow the program applies a fixed linear transform, a scale on each axis plus an offset, and never mentions it. The run ends when a shot hits the centre.
In as few shots as you can is what made the pauses worth timing: it gave participants a reason to think before clicking instead of spraying the screen.
Every attempt wrote six columns to disk: attempt number, click position, arrow position, distance from the arrow to the centre, timestamp, and whether the shot hit. No names or identifiers were recorded.
Fourteen senior undergraduates volunteered, in unpaid sessions of about a minute. Thirteen datasets were valid. The fourteenth participant fired hundreds of shots where everyone else needed a handful, which is clicking rather than converging on a rule, so I excluded that dataset and the thesis reports the exclusion with the count.
The Instrument
PsychToolbox handled display timing; about four hundred lines of my own MATLAB ran the experiment.
A deliberation time only means something if the frame a participant reacted to appeared when the program thinks it did. PsychToolbox, the open-source MATLAB toolkit long used for timed visual experiments, handled that layer of display refresh and input polling.
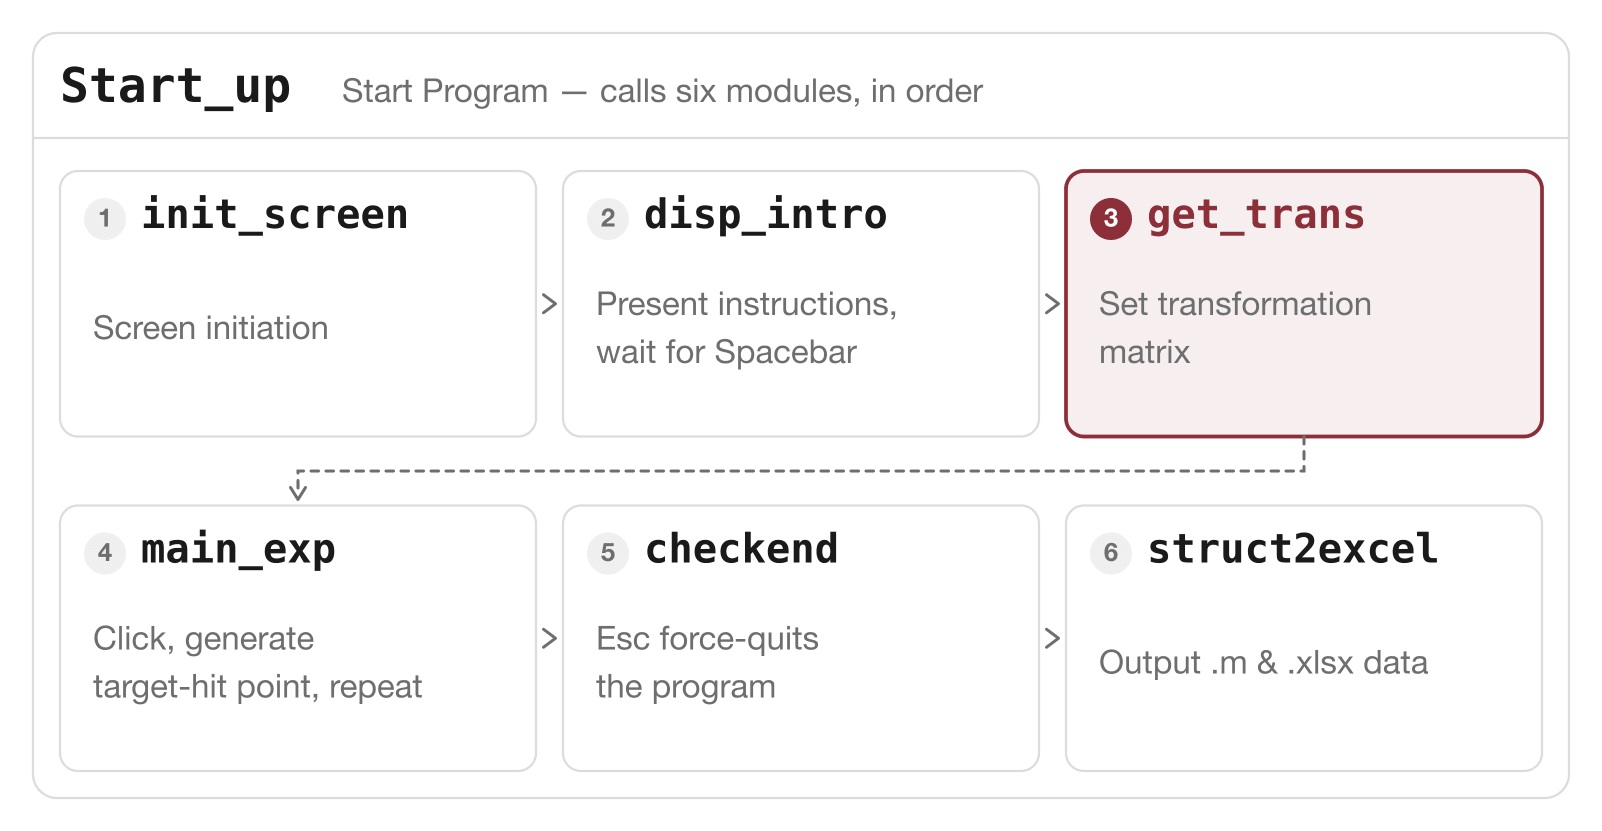
Everything above it I wrote: about four hundred lines of MATLAB, listed in the thesis appendices. A start-up script calls six modules in order, from opening the display and showing the instructions to building the hidden transform, running the trial loop and writing each session out. One of them does nothing scientific: it listens for the Escape key, because the experiment takes over the whole screen and a participant who hits a bug would otherwise have no way out. The instruction card tells them so.
Inspect the module structure and the transform code
Start_up runs a session and calls six modules in the order they fire:
init_screen: opens the display.disp_intro: draws the instruction card and waits for the spacebar.get_trans: builds the transform matrix.main_exp: runs the trial loop: draws the target, polls the mouse, places the arrow and logs the result.checkend: watches for the Escape key.struct2excel: writes the session out.
The run order, drawn from the defence deck's own module list and procedure. Neither the deck nor the thesis ever diagrammed it.
get_trans is the shortest module and the most consequential: it assembles the scale and offset that separate where a participant clicked from where the arrow landed.
The English programming walkthrough steps through every module in the order it runs.
The Estimate
Recovering a transform the program already knew checked the estimator; it did not discover anything about people.
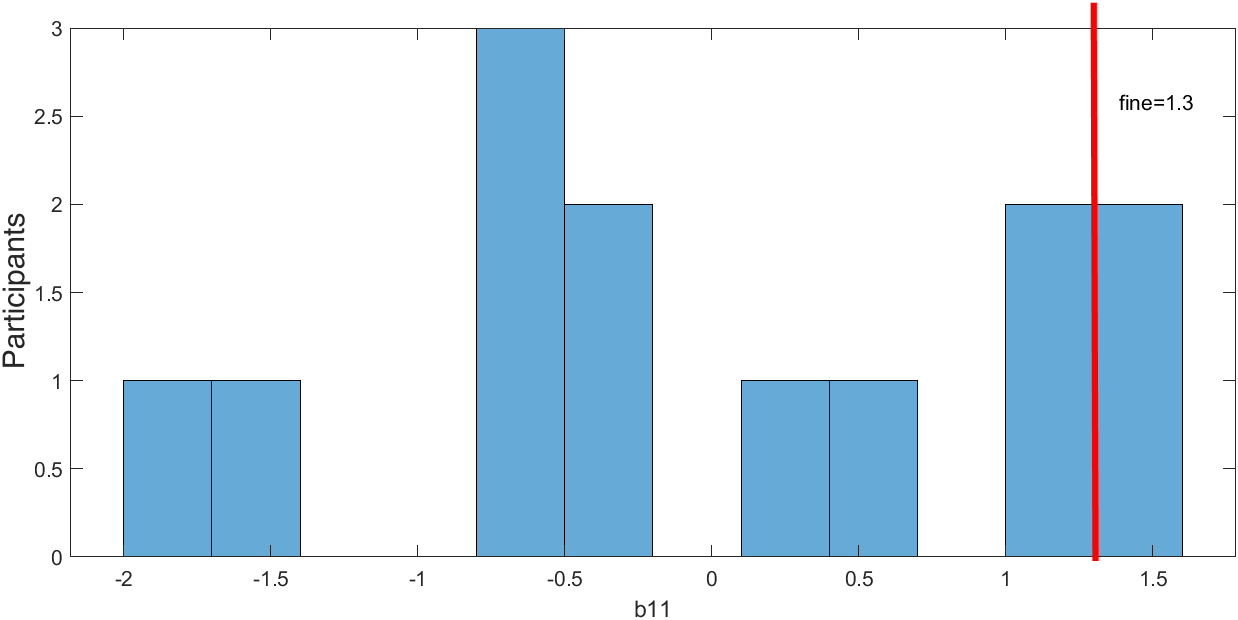
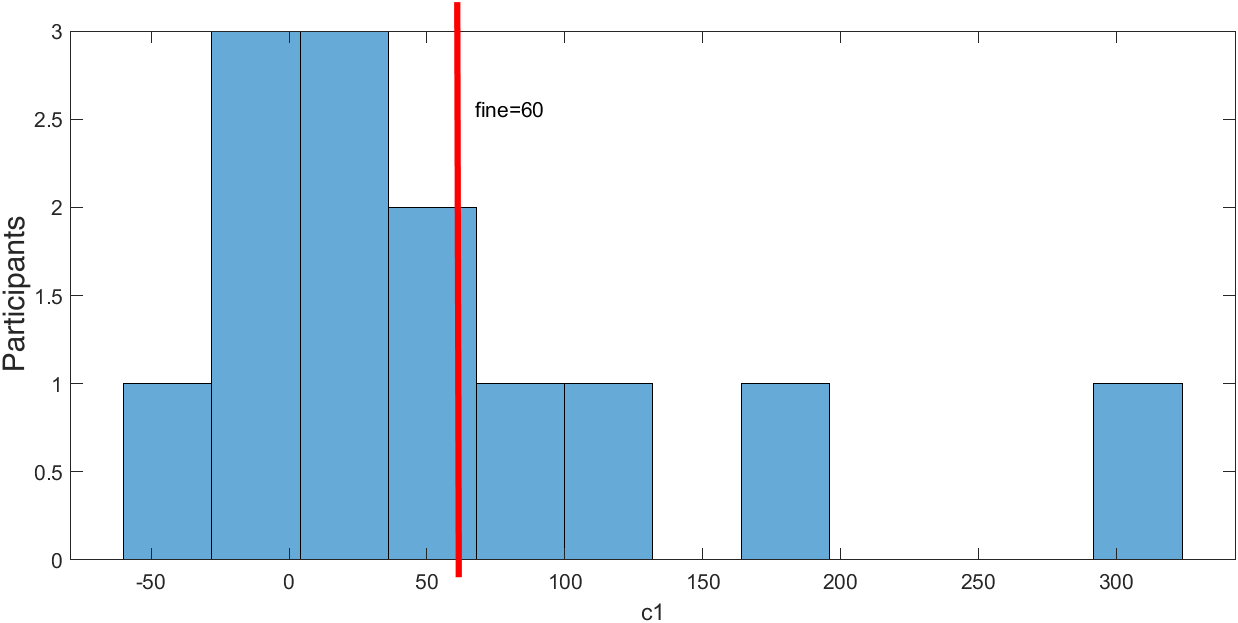
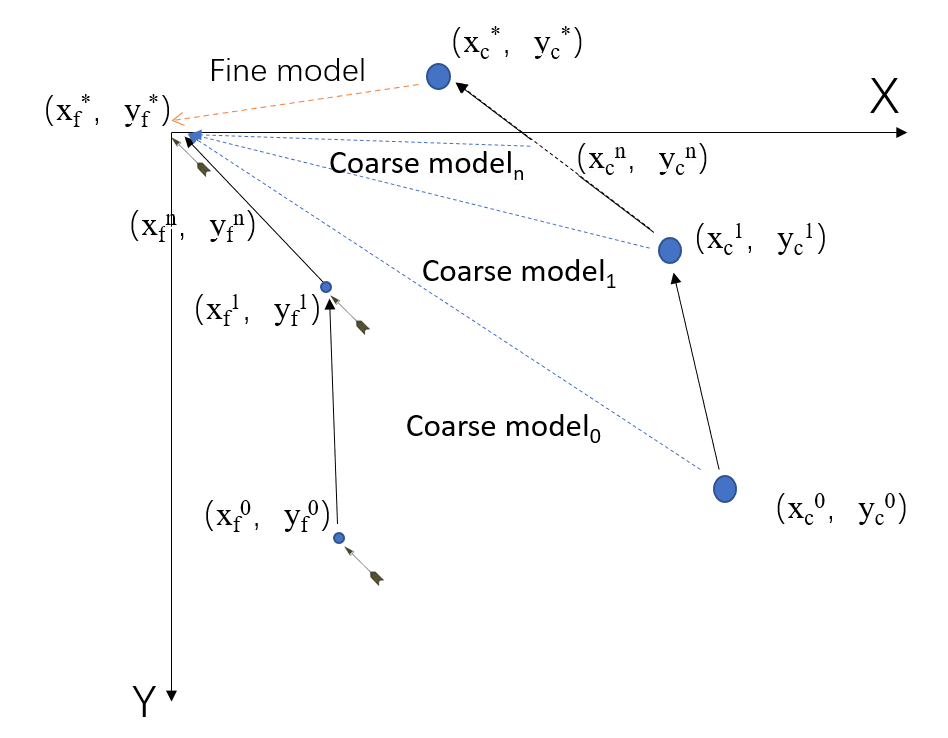
The analysis borrowed Space Mapping from electronic design, where an engineer aligns a fast, rough model of a device with a slow, accurate one. Here both models described the same transform. The fine model was the program's own: a scale of 1.3 on x and 1.5 on y, plus a fixed offset, known in advance. The coarse model was estimated separately for each participant from their clicks and landing points, by multiple linear regression with least squares in MATLAB's regress: six unknowns, fitted thirteen times.
Because the fine model was known, recovering it is a check that the estimator worked, not a finding about people. Across the thirteen fits, the estimates fall either side of the program's values: the scale term brackets 1.3 and the offset term brackets 60. They bracket rather than cluster, and the spread across participants is wide.
Read how Space Mapping was adapted
In electronic design, Space Mapping lets an engineer avoid repeatedly running an expensive, accurate simulation by re-estimating a cheap one until it can be trusted. It is used, for example, to tune microwave filters. The thesis cites the technique's canonical survey first (Bandler, Cheng et al., IEEE Transactions on Microwave Theory and Techniques, 2004), co-authored by the advisor who set this topic.
Applying it here inverted one thing. In electronic design the engineer chooses the coarse model's simplification. Here the coarse model stood for a person's working account of the mapping: it could not be opened or chosen, only estimated from what they did. The thesis's literature review found no earlier work applying Space Mapping to human behaviour.
Findings
Most participants settled near one second per shot, and their shots moved toward the centre.
Both results are descriptive observations from thirteen people taking four to seven shots each.
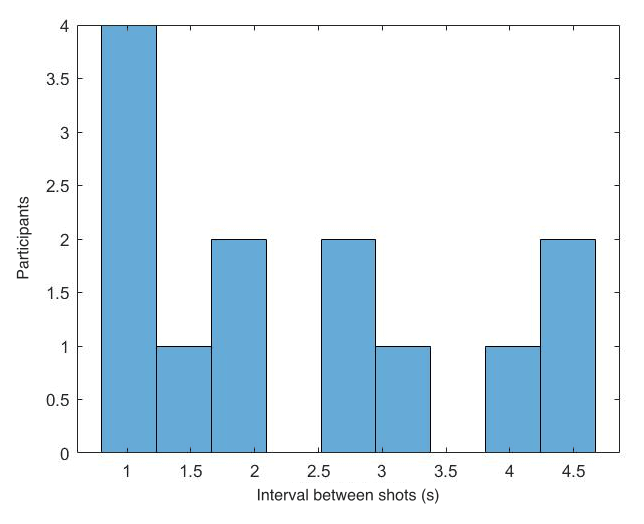
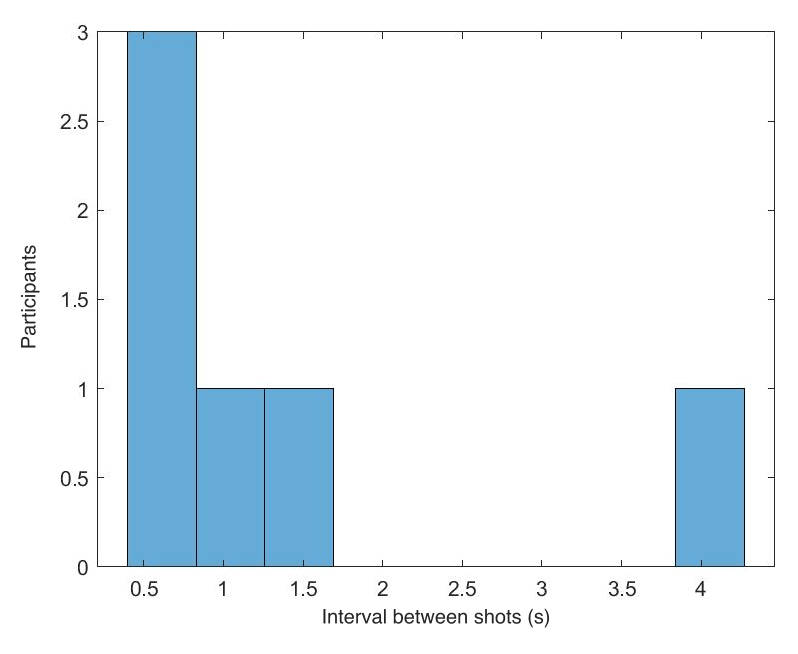
The first is time. The interval between shots is scattered on the first and second attempts. From the third onward, most participants settle near one second, and intervals longer than five seconds become rare. Most finished in four or five attempts; one needed seven.
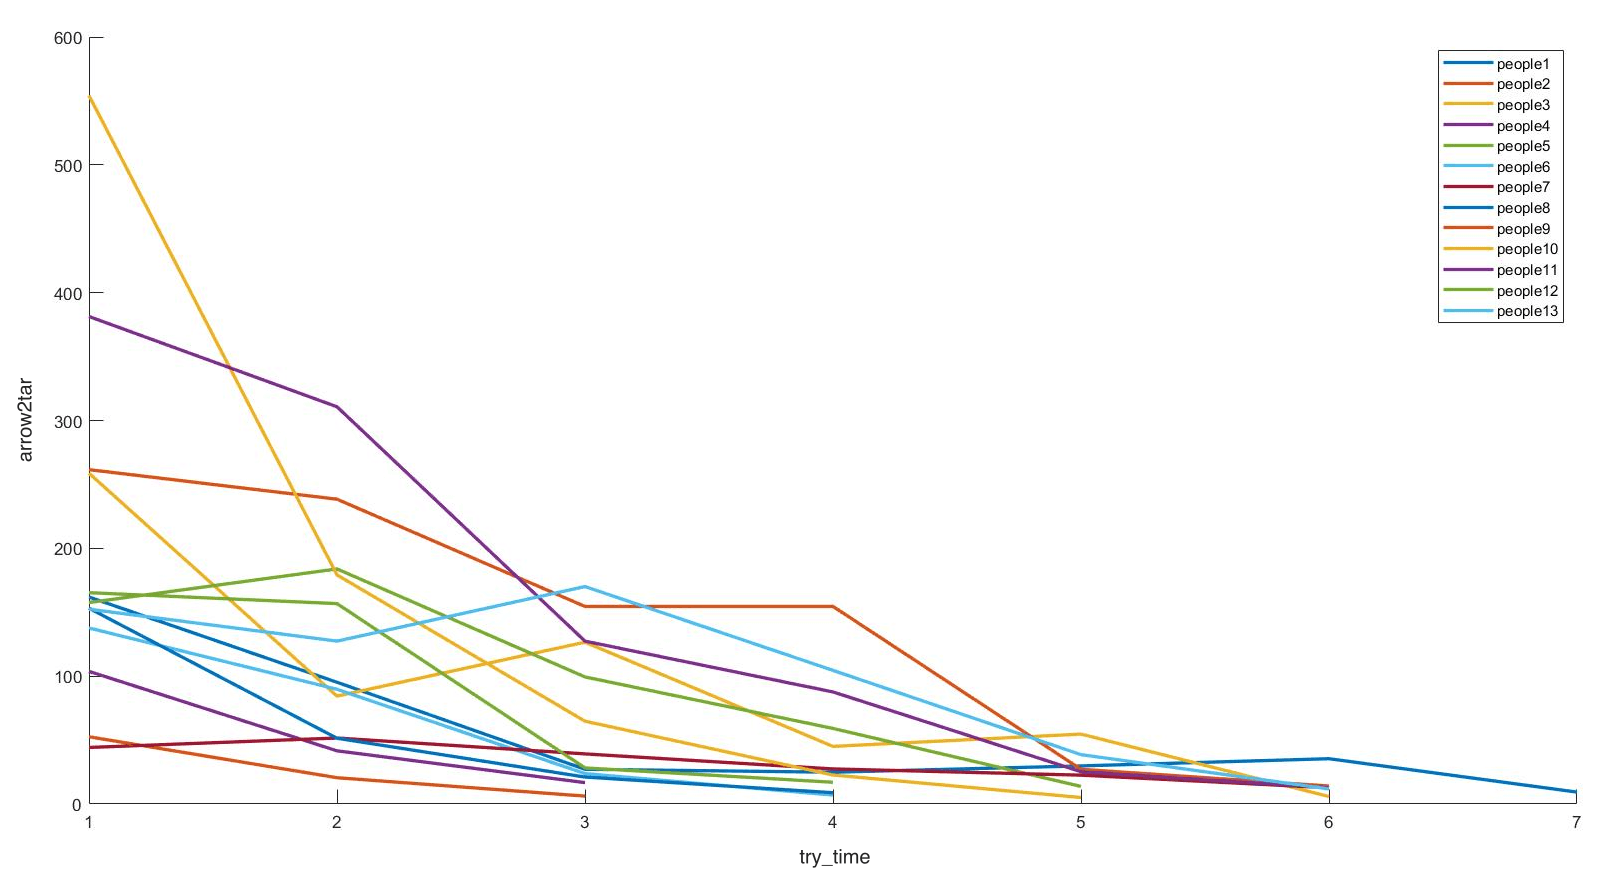
The second is distance. Each participant's distance from the arrow to the centre falls over their attempts, at different rates, and some lines rise before they fall. Reaching the centre is built into the task, since a run ends on a hit. What the chart adds is the path: people were correcting, not guessing, which is the assumption the model estimate depends on.
No significance test was run on either result. With so few attempts per person, the thesis judged a per-participant analysis unreliable and compared the thirteen curves descriptively instead. It named what a larger dataset would need: interval estimates for the regression coefficients, significance tests on the multiple regression, residual analysis, and filtering trials by the time between shots.
In Hindsight
The model being estimated was a person's account of an interface that never explained itself.
Described in today's vocabulary, the study put people in front of an input mapping that was unfamiliar and undocumented, let them build an account of it through repetition and feedback from their own actions, and instrumented the time to decide and the size of the error. The thesis called it a cognitive model; I would now call it a mental model.
I started a master's in human factors that August. I am not claiming the capstone caused that. The thesis is dated 15 May 2021, and it shows the interest in how people behave inside a system was already part of the engineering work.